
The real-time dashboard on this page displays each project's:
- total capacity
- current number of sign-ups
- waitlist count (if the project is full)
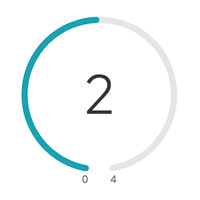
See the examples below to learn how to read the dashboard:

The real-time dashboard on this page displays each project's:
See the examples below to learn how to read the dashboard:
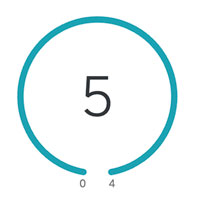
In Example 1, the project has a capacity of 4. Since 5 people signed up, 1 person is on the waitlist.
In Example 2, the project has a capacity of 4. With 2 people signed up, there are still 2 spots available and there's no waitlist.

Center for Earth and Environmental Science (CEES)IU Indianapolis
723 West Michigan Street